


Homebuilders [$DHI, $LEN, $PHM, $LGIH, $NVR, $KBH, $DFH]
A closer look at the Homebuilders and Homebuilding Value Chain.

^PDF Document attached for easier reading
Homebuilders don't actually build homes. They act more as project managers, overseeing the business aspects of homebuilding. In this industry, companies are generally organized in a decentralized manner, consisting of multiple operating divisions and one corporate headquarters. As homebuilding is seen as a local business that requires an intimate understanding of the local environment and economics, each operating division makes its own decisions and analyses. However, this can sometimes lead to confusing and uncoordinated actions among operating divisions, where divisions submit bids against each other for subcontractors, land, and other inputs. The key role of the headquarters is to oversee these divisions and minimize such inefficiencies through capital allocation and financing activities. The corporate headquarters is also responsible for monitoring inventory levels and setting incentive plans for the sub-operating divisions.
To many, this industry seems to be shrouded in complex macroeconomic mechanisms such as interest rates, housing stock and flow, policies, and asset class returns. To make things worse, other industry forces like rental rates and housing vacancies, cumulative housing deficits and surpluses, home insurance rates, local build densities, and regional growth add to the complexity. I can understand how this industry looks daunting. While I do not disagree that understanding these factors would be helpful, I also feel that anything beyond a fundamental understanding would not necessarily help you understand the performance of your investments in these homebuilders.
To start, many of the variables mentioned above are important but simply unknowable in advance, such as the direction of interest rates. Secondly, these variables have industry-wide implications, meaning all homebuilders will equally face the same challenges, such as rising home insurance premiums. Therefore, a lot of these variables are unlikely to contribute to any explanation of divergent performance among the homebuilders.
I have come up with a quick 4-factor checklist that serves as the Pareto principle to understanding the most impactful forces in this industry.
Firstly, cumulative housing shortage. This factor, as the name suggests, refers to the years of underbuilding by homebuilders since the housing crisis, leading to the "housing shortage" we now face. Luckily for us, the blogger 10th Man has written an in-depth paper on how he modeled this cumulative housing shortage and the variables at play.
The second most important factor is knowing the business model type of the homebuilder (Traditional/Asset-Light). This provides insight into the expected capital efficiency and scalability of the business. The tricky aspect is that most companies operate with a mix of outright ownership and controlling via options. Hence, the important thing is to determine which approach the company leans towards.
The third factor is understanding the land bank exposure and the current operating scale in terms of build densities. Build densities drive profitability, not market share. This is extremely difficult to judge and requires observation of when a typical inflection point in building densities occurs based on historical performance. However, even then, it may not be accurate. Nonetheless, things at the extreme are often easier to judge. Therefore, when you see inventory regions mainly in new areas, this signals that profit margins are likely to decline moving forward.
Lastly, consider the customer profile of the company. A higher concentration of low-income customers indicates a heightened sensitivity to mortgage rates, as observed in LGI Homes. I believe these four factors are sufficient to explain most of the differences in financial performance and return profiles among homebuilders.
Share Price of Largest National Homebuilders in U.S. [2006 – 2024]

At first glance, these companies appear to be good stock compounders. Since 2009, D.R. Horton and Lennar have increased their market capitalization by 12.5x and 18x respectively, while PulteGroup and NVR have grown theirs by 5x to 6x, yielding annualized returns of 10% to 20%. However, these returns are largely due to low-base effects following the 2007-08 housing crisis. In fact, if you consider a reasonable period prior to 2007, their share prices would have increased at most 8x, with most returning between 2x and 3x, highlighting the cyclical nature of these companies and the crucial impact of market timing on investment returns.
Before I start analyzing the homebuilding industry, I will systematically examine the homebuilder value chain to identify potentially better ways to gain exposure to housing themes, aiming to avoid macro volatility and benefit from more favorable competitive dynamics. I will then quickly analyze each key player and provide justification for either accepting or rejecting them [In the Appendix]

The homebuilding industry can be split into 4 unique segments, upstream product manufacturers, Distributors, Homebuilders, Brokers and Online Platforms.
Firstly, upstream product manufacturers. To save some time and words, I shall quickly explain how I see this sub-sector and my reasons for rejecting them or accepting them as potential ideas. The framework for this sub-sector is similar to a commodity producer/manufacturer. Generally, products are hard to differentiate, and pressure from low-cost competitors from overseas squeeze margins and growth. This leads to a few scenarios: some companies have reasonable growth but poor returns on capital as they sacrifice profit margins for growth. Others have good returns on capital and margins but experience slow growth, competing only in areas where they have advantages, such as localized cognitive association from branding. The last scenario is adopted by industrial conglomerates that pursue growth through acquisitions to consolidate their industries. However, the return on capital for these companies is decent at best, shifting the bet to how well they pursue M&A opportunities instead. The plus side of investing in this sub-segment is that you have an added exposure to upgrading and renovation demand, rather than just on new homes construction demand.
I have attached a list of key players in each sub-sector in the appendix, as well as a quick thesis for each company. Of the list, only Eagle Materials (Insulation), Masco (Plumbing), and Paint Companies (Sector) are worthy of further investigation.
Moving down the value chain, we have the distributors of such home building products.

The capital efficiency of these homebuilding distributors makes it a much better space to fish compared to the product manufacturers themselves. Distributors remove the risk of individual brand betting and shift the game to a battle of logistic network scale and closeness to customers/suppliers. Like many other distributors in different industries, this segment primarily has low barriers to entry. However, competitive advantages can be built by having strong customer relationships, either through local servicing density or the ability to satisfy customer needs in terms of breadth of products or speed. A differentiated distributor acts as an implicit outsourced supply chain manager, improving worker productivity, simplifying the supply chain for customers, and reducing working capital needs and total procurement costs for customers. Similarly, a detailed list of key players as well as coverage on each key player is attached in the Appendix. Of these players, TopBuild, Installed Building Products and Ferguson are worthy of further investigation
Then, we have the distributors of the actual homes, including real estate brokers and online platforms. Some noteworthy companies include Rightmove, REA Group, Zillow, Compass and PropertyGuru. This space is interesting due to “digitalization” themes opportunities and current penetration of homes sold through platforms is still low. The idea is that since cars now are sold online, perhaps maybe homes too?

A quick look at these companies reveals obvious variations in return profiles, indicating geographic dynamics and customer preferences at play. Secondly, return on invested capital (ROIC) may not be a good indicator of the strength of the business, as these brokerages are essentially just online platforms with low capital intensity. After considering the lackluster growth factor, I can comfortably reject this subsegment altogether. I do not like the space because 1) Return profiles varies due to the differences in customer preferences and norms which are hard to quantify (
There are also many reasons behind the persistent low penetration in digitally sold homes. Customers still prefer the human touchpoint with a realtor and agent for accountability, as well as the peace of mind from seeing the actual home, condition, and environment. Therefore, although online home platforms help reduce initial searching costs by consolidating available homes, they may not necessarily be the ones capturing the value or sale, as seen in the financials. This leads us to only 5 additional ideas worthy of further investigation in the entire homebuilder industry. I will write about them (if they are worth writing about) in future papers.
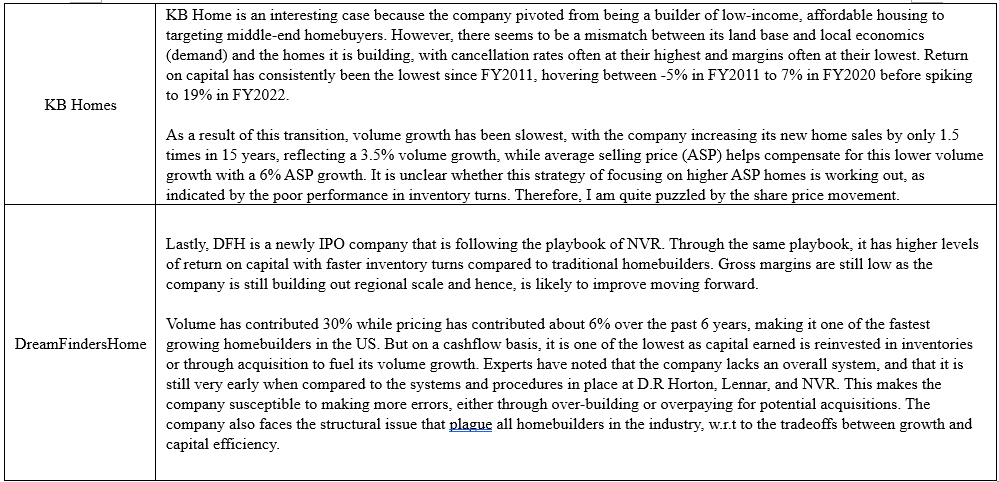
Homebuilders [$DHI, $LEN, PHM 0.00%↑ , $LGIH, $NVR, $KBH, DFH 0.00%↑ – Deep Dive
Homebuilding is essential to society, yet the industry's operational dynamics, which require companies to acquire land outside their established build densities to grow, prevent any single company from gaining lasting economic cost advantages. Consequently, any current advantages are likely to revert to the industry mean in the long run, with no company able to consistently outperform. The two largest homebuilders, D.R. Horton and Lennar, enjoy some cost benefits from their large scale. However, the industry's extremely cyclical nature, intense competition, and capital intensity have prevented them from earning consistent economic profits over the years, with ROIC averaging between 10-12% before the COVID-19 pandemic. Furthermore, since homebuilding is predominantly a variable cost business, companies do not benefit significantly from large increases in volumes.
The homebuilding industry is essentially comprised of many local housing markets, each with its own unique characteristics such as demographics, population density, employment levels, housing starts, housing mix, and local economics. Due to these local factors, national market share can be misleading, as the economics of the business are driven by local economies and build densities rather than national market share. For example, a company like D.R. Horton, with five times the market share of another national builder, may still have lower margins and return on capital. This is because profitability is primarily influenced by the builder’s current land bank exposure and build densities.
As land is a one-time use asset, companies need to continually establish new regions to grow, losing whatever cost advantages they have from their current operations. Therefore, the key to success in this industry then lies in consistently gaining access to the best land locations at the lowest possible price. However, this is extremely difficult to achieve consistently. Typically, in any given market, most developers are aware (or made aware) when large parcels of land become available, eliminating any information or speed advantage. While some builders manage to develop special relationships with land brokers and third-party developers, this strategy is challenging to scale.
Although it has become more difficult to obtain capital from financial institutions since the housing crisis in 2007, the homebuilding industry remains one with low barriers to entry. This results in a fragmented industry, with over 15 public homebuilders and many more private regional and local homebuilders all competing for the same land, materials, labor, and customers. The fragmented nature of the industry makes it difficult for participants to remain rational during bullish cycles, often leading to aggressive incentives or bidding up land deals. This inevitably drives down the return on capital for the industry.

Incumbents such as D.R. Horton and Lennar hold little advantage over other national builders, as competitors can easily replicate their systems and strategies. While the scale of D.R. Horton and Lennar provides some cost efficiencies relative to smaller builders, these efficiencies are not significant when compared to other national builders. In fact, D.R. Horton and Lennar’s margins have generally been in line with industry averages. Beyond cost advantages, large incumbents can typically take on more risk, such as purchasing large plots of undeveloped land, due to their substantial capital base. However, this capability is not necessarily advantageous due to trade-offs in capital efficiency. Securing the proper entitlements can take years, leaving the land tied up on the balance sheet (average 30 -50% assets is in undeveloped, developing lands) during this time and resulting in lower returns on capital.
Homebuilders are well aware of the trade-off between land banking and capital efficiency. As a result, many have adopted a new model of controlling land through land options, typically arranged using Land Purchase Agreements (LPAs), a model pioneered by NVR. NVR is the Wall Street darling and poster child for the industry, with nearly 100% of its land controlled via options. The advantage of this approach is that it mitigates the risks associated with land banking. However, this method often incurs higher costs, leading to lower margins due to the premium price paid to developers who bear all the risk.
NVR maintains its margins through strict discipline and adherence to its “box” strategy, operating only within this predefined framework. The downside is that NVR experiences lower growth and an inability to scale as it remains confined to this predefined box.

The above table shows the number of home sales across key players. NVR manages to grow 2x in scale over the past 15 years, as compared to Lennar and DR Horton that grew 8x in scale.

Correspondingly, NVR is always the slowest growing among the 4 top public homebuilders in the US. But it compensates with a consistently higher return on capital (Table Below).

Top 4 Company Key Operating Metric Comps

Individual Company Coverage and Key Insights

Consolidation in the Industry
Since 2001, the top 15 builder market share has increased from 14% to 34% in FY2019. This trend of national builders gaining further market share is likely to continue, due to the advantages from scale and resources. However, it is important to note that the advantages of such scale and resources are namely against the smaller players who typically on average, complete around 26.3 homes per year, while the median is closer to 5.0 homes per year. Therefore, even with these trends of meaningful consolidation, the industry still does not see an improvement in profitability, with ROCE and EBIT margins being slightly more or close to the early 2000s level.
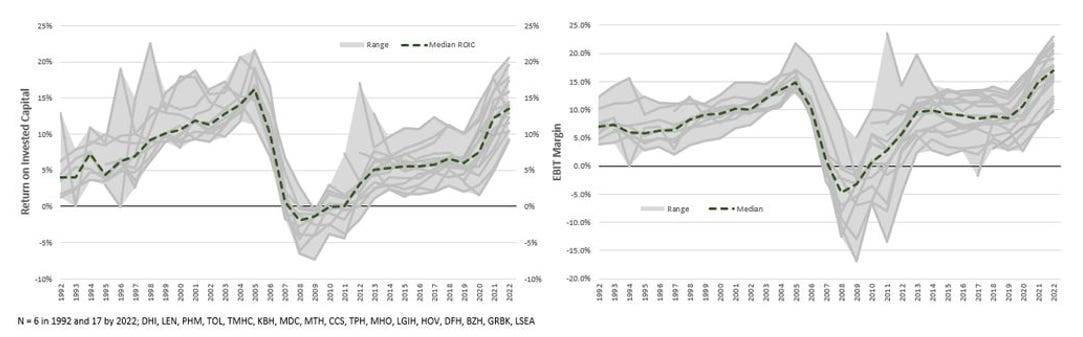
This provides two key insights: Firstly, the growth in scale and industry consolidation is achieved by sacrificing profits and margins to gain market share. Companies trade off cost efficiencies from scale to outbid competitors and secure land inventory. This explains why, even though the market share of the top two national builders has increased five-fold, gross margins have remained unchanged. Therefore, even with further industry consolidation in the future, we should not expect any significant improvement in industry-wide profitability.
Growth Drivers in the Industry
The formula for growth in the homebuilding industry fundamentally relies on the volume x price relationship. However, volume growth in this industry is driven by macroeconomic factors such as population growth and household composition. On average, volume growth is minimal, with the US population expected to grow at around 0.5% per year and household composition averaging around 1.97 adults per home. Without significant economic shocks or policy changes, these drivers are unlikely to change much.
An additional variable influencing volume growth in this industry is the housing stock deficit resulting from years of low housing starts following the 2007 housing crisis. Current estimates of household deficits range from 1.5 million to 6.5 million (with Fannie Mae estimating 3.8 million, NAHB estimating 1.5 million, and NAR estimating 5.5 million). One way to reach the higher end of these estimates is to adjust the household composition level to either the 1990s level of 1.92 adults per home or move it closer to the current levels of 1.96 to 2. The lower the adults per home metric, the higher the demand for housing. However, due to affordability challenges for first-time buyers, it is unlikely that household composition will return to 1990s levels. Therefore, the housing deficit is more likely to be in the range of 1.5 million to 3 million.
Assuming a population growth rate of 0.5% and a constant adults per home metric, this would lead to a natural demand of about 700,000 homes per year. Adding in additional demand from losses in housing stock and vacancy rates, we estimate a total demand of about 1 million homes per year. This suggests that the current level of 1.4 million completions is oversupplying the industry, making it likely that completions will fall toward the equilibrium rate of 1 million homes per year. Even in the case that the natural demand is higher, it would still suggest a balanced housing market, rather than a severely imbalanced (deficit) housing market that the media seem to imply.
Nonetheless, large public homebuilders like D.R. Horton and Lennar can grow volume by gaining market share from smaller homebuilders. Over the past 15 years, volume growth accounted for 10-12% growth for these two largest companies. Coupled with an average 4% growth in average selling price (ASP) of homes, this explains the strong 20+% earnings growth over the past 15 years. However, it is important to note that such growth is likely unsustainable moving forward. Homebuilders were coming off a low due to the 2007 housing crisis, which led to years of undersupply, followed by the unexpected COVID-19 pandemic, which increased housing demand. As we expect the market to normalize with high rates of housing completions, these high earnings growths are expected to taper off.
How Homebuilders Price Their Homes
Firstly, location is everything in real estate. This is true even in housing downturns, when new home communities suffer from declining prices much more than existing homes. In theory, developers would rather develop land in outlying locations of metropolitan markets, where land costs are slightly lower and more abundant, making it easier to have long runway with good build densities. However, for the homeowner, the long-commuting times is less attractive due to high costs as well as opportunity cost of unproductive time and hence, may prefer to find affordable resale houses that are closer to work. Therefore, homebuilders must balance these differences between customer wants and economic practicalities. Most homebuilders typically settle with finding developed land closer to such metropolitans, rather than rural/ex-urban locations.
So, the process typically starts with each company’s land acquisition expert scouting the local markets for available land. Then, they will research the local economic characteristics, with particular attention paid on the median age and median income of the market. Once determined to be suitable, they will look at recent sales of new homes in the region. What these historical sales will provide is a sense of the type of houses, the valuation of the houses, the characteristics of the local demand and whether it fits with the company’s strategy. For example, certain companies like LGI Homes stick to a very rudimentary design and layout. Lennar has an all-included plan that has the upgrades that are commonly seen in the community. DR Horton has a tried and repeated system of building a few specific models. Then, based on these differences between the recent home sales and the type of houses the company typically builds, homebuilders will adjust the valuation to arrive at a hypothetical sale price for their house (Expected ASP).
With this hypothetical sale price, the builders then work backwards and input a minimum rate of return (typically within 15% - 20% after tax) to determine how much they are potentially willing to pay for the land. Thus, achieving good returns on capital and scale requires placing low bids on the land. Only with low bids on land can the industry as a whole achieve higher returns on capital. However, during bull cycles, this is typically not the case. The fragmented nature of the industry, combined with low barriers to entry, often results in irrational builders bidding up land prices based on assumptions of stronger demand and higher future sale prices. This eventually leads to projects with poor IRRs and shaky assumptions, and worse, to overbuilding in the industry. This dynamic is what makes high returns for the industry to be unsustainable in the long run.
Unit Economics - Illustration

The majority of homebuilding costs are allocated to construction, encompassing materials and labor costs. These expenses are often pass-through costs which are already accounted for in the expected average selling price (ASP) during the sales process as explained above. Consequently, if construction costs rise, the ASPs of finished homes across the industry also increase. While large homebuilders benefit from scale advantages in construction compared to smaller builders, our data shows that the gross margins of the largest homebuilders, such as DR Horton and Lennar, are comparable to other large public homebuilders. This indicates no significant cost advantages among large homebuilders, leading to commoditized returns and margins even as the industry consolidates further.
Hence, the primary driver of fluctuations in builders' margins across cycles is the land factor. Consider a generic builder with 4-5 years of lot inventory, where these lots constitute 30% to 50% of its balance sheet assets. Assuming the finished homes maintain a consistent average selling price (ASP) of $400,000, builders determine the maximum price they are willing to pay for the lot, which would be $80,000 (20% of $400,000). However, if ASPs drop by 20%, the cost of land now accounts for 25%, reducing a typical operating margin of 8% to 3%. Conversely, during a bullish market, when ASPs increase more than expected, operating margins can expand significantly. This was evident during the recent COVID-19 pandemic, when a demand spike caused ASPs to increase by close to $100,000 on average across homebuilders, driving the margins of these public homebuilders from around 20% in FY2019 to 29% in FY2022. Unfortunately, predicting these fluctuations 4-5 years in advance is nearly impossible, despite its critical importance.
Regarding Land Purchase Agreements (Options) that the industry is tilting towards, does this change the unit economics of the business? The short answer is no; land will still cost around 20% of the total project. However, what LPAs do is reduce the risk of massive impairments during a downcycle. In 2007, the industry wrote down $25 billion in land value impairments. LPAs do not stop the overbuilding/speculative behavior that is inherent in the industry, but they hedge the downside. On the flip side, you could argue that LPAs could increase land costs beyond the average 20%, as homebuilders need to pay the “full price” to the developer for shouldering most of the risks. This would drive operating margins down even further for the industry. The only reason why NVR could operate at comparable margins despite having nearly 100% of its lots controlled via options is that it adheres to a predefined “box” where it operates within established parameters. These likely include only operating in metropolitan areas and on the East Coast, where it is familiar with the regulations and local needs.
Closing Thoughts
To invest wisely in this sector, it seems prudent to follow Buffett’s advice of “being greedy when others are fearful.” Admittedly, this is not an easy task. However, let's consider the facts: The housing crisis of 2007 set the stage for explosive growth in homebuilders over the next 15 years. Homebuilders became more prudent about debt levels and overinvestment, leading to more rational behavior and less overbidding on land prices while capitalizing on the housing deficits. This, in turn, elevated overall returns on capital for the industry from higher asps and lowest costs. However, such rational behavior and higher industry returns are not guaranteed in the future. The low barrier to entry and competitive dynamics, where participants compete for the same resources, make it challenging for players to remain rational in a bullish market. Additionally, the industry's operational dynamics—where land is the most critical input, but no one can secure low-cost land inventories as a sustained advantage—suggest that current advantages will likely revert to industry averages in the long run.
If I had to choose a company to invest in, my money would be on NVR. Despite its lower volume growth, what I value is not its growth or competitive positioning, but rather its management discipline, sanity, and courage to act aggressively when opportunities arise and hold back when the market is irrational. Since I am no better than the average person at timing the market, I will leave it to the experts to do so on my behalf. This is an approach I believe could potentially work out in the long run.
Another possible approach would be to look for extremes in the housing market, which could make timing the market simpler. This makes China a possible ground for fishing for stock compounders. However, I need to do more work to differentiate the innate differences between the housing markets in China and the United States, and consider factors like government interventions, the nature of crises, and market participants. As a result, I am unable to make any solid recommendations or suggestions at this time.
The last approach, and potentially a simpler and smarter one (at least to me), would be to move on and find other opportunities.
Appendix
Upstream Product Manufacturers
1. Publicly listed upstream building product manufacturers include companies that produce ceilings (Armstrong World), wallboard (Eagle Materials), windows (JELD-Wen), flooring (Mohawk, Tarkett, Interface), plumbing (Fortune Brands, Masco, Lixil, TOTO, Geberit), cabinetry (Fortune Brands, American Woodmark), paint (Sherwin Williams, RPM International, Masco, PPG), roofing (Carlisle Companies), and tools (Stanley Black & Decker, Techtronic Industries, Makita, Snap-on). Additionally, industrial conglomerates like Saint-Gobain and Owens Corning have broad exposure in these sub-sectors, including insulation and composites.
Below is a quick thesis for each company in the upstream space. If you have any insights or disagreements, please feel free to leave a comment and share your opinions!

Key Players in the HomeBuilding - Distributors
Then still within the upstream segment, we have the distributors of such products, from specialized distributors of building materials (GMS Inc, Builders FirstSource), distributors for insulation (TopBuild, Installed Building Products), and distributors for Plumbing (Ferguson).

Market share of home builder


